Admin User Interface
Dashboard
The Dashboard provides system information, server logs, deployment tools, and configuration options for the Admin UI. This is the default landing page after login and gives you a quick overview of the system state.
About Me
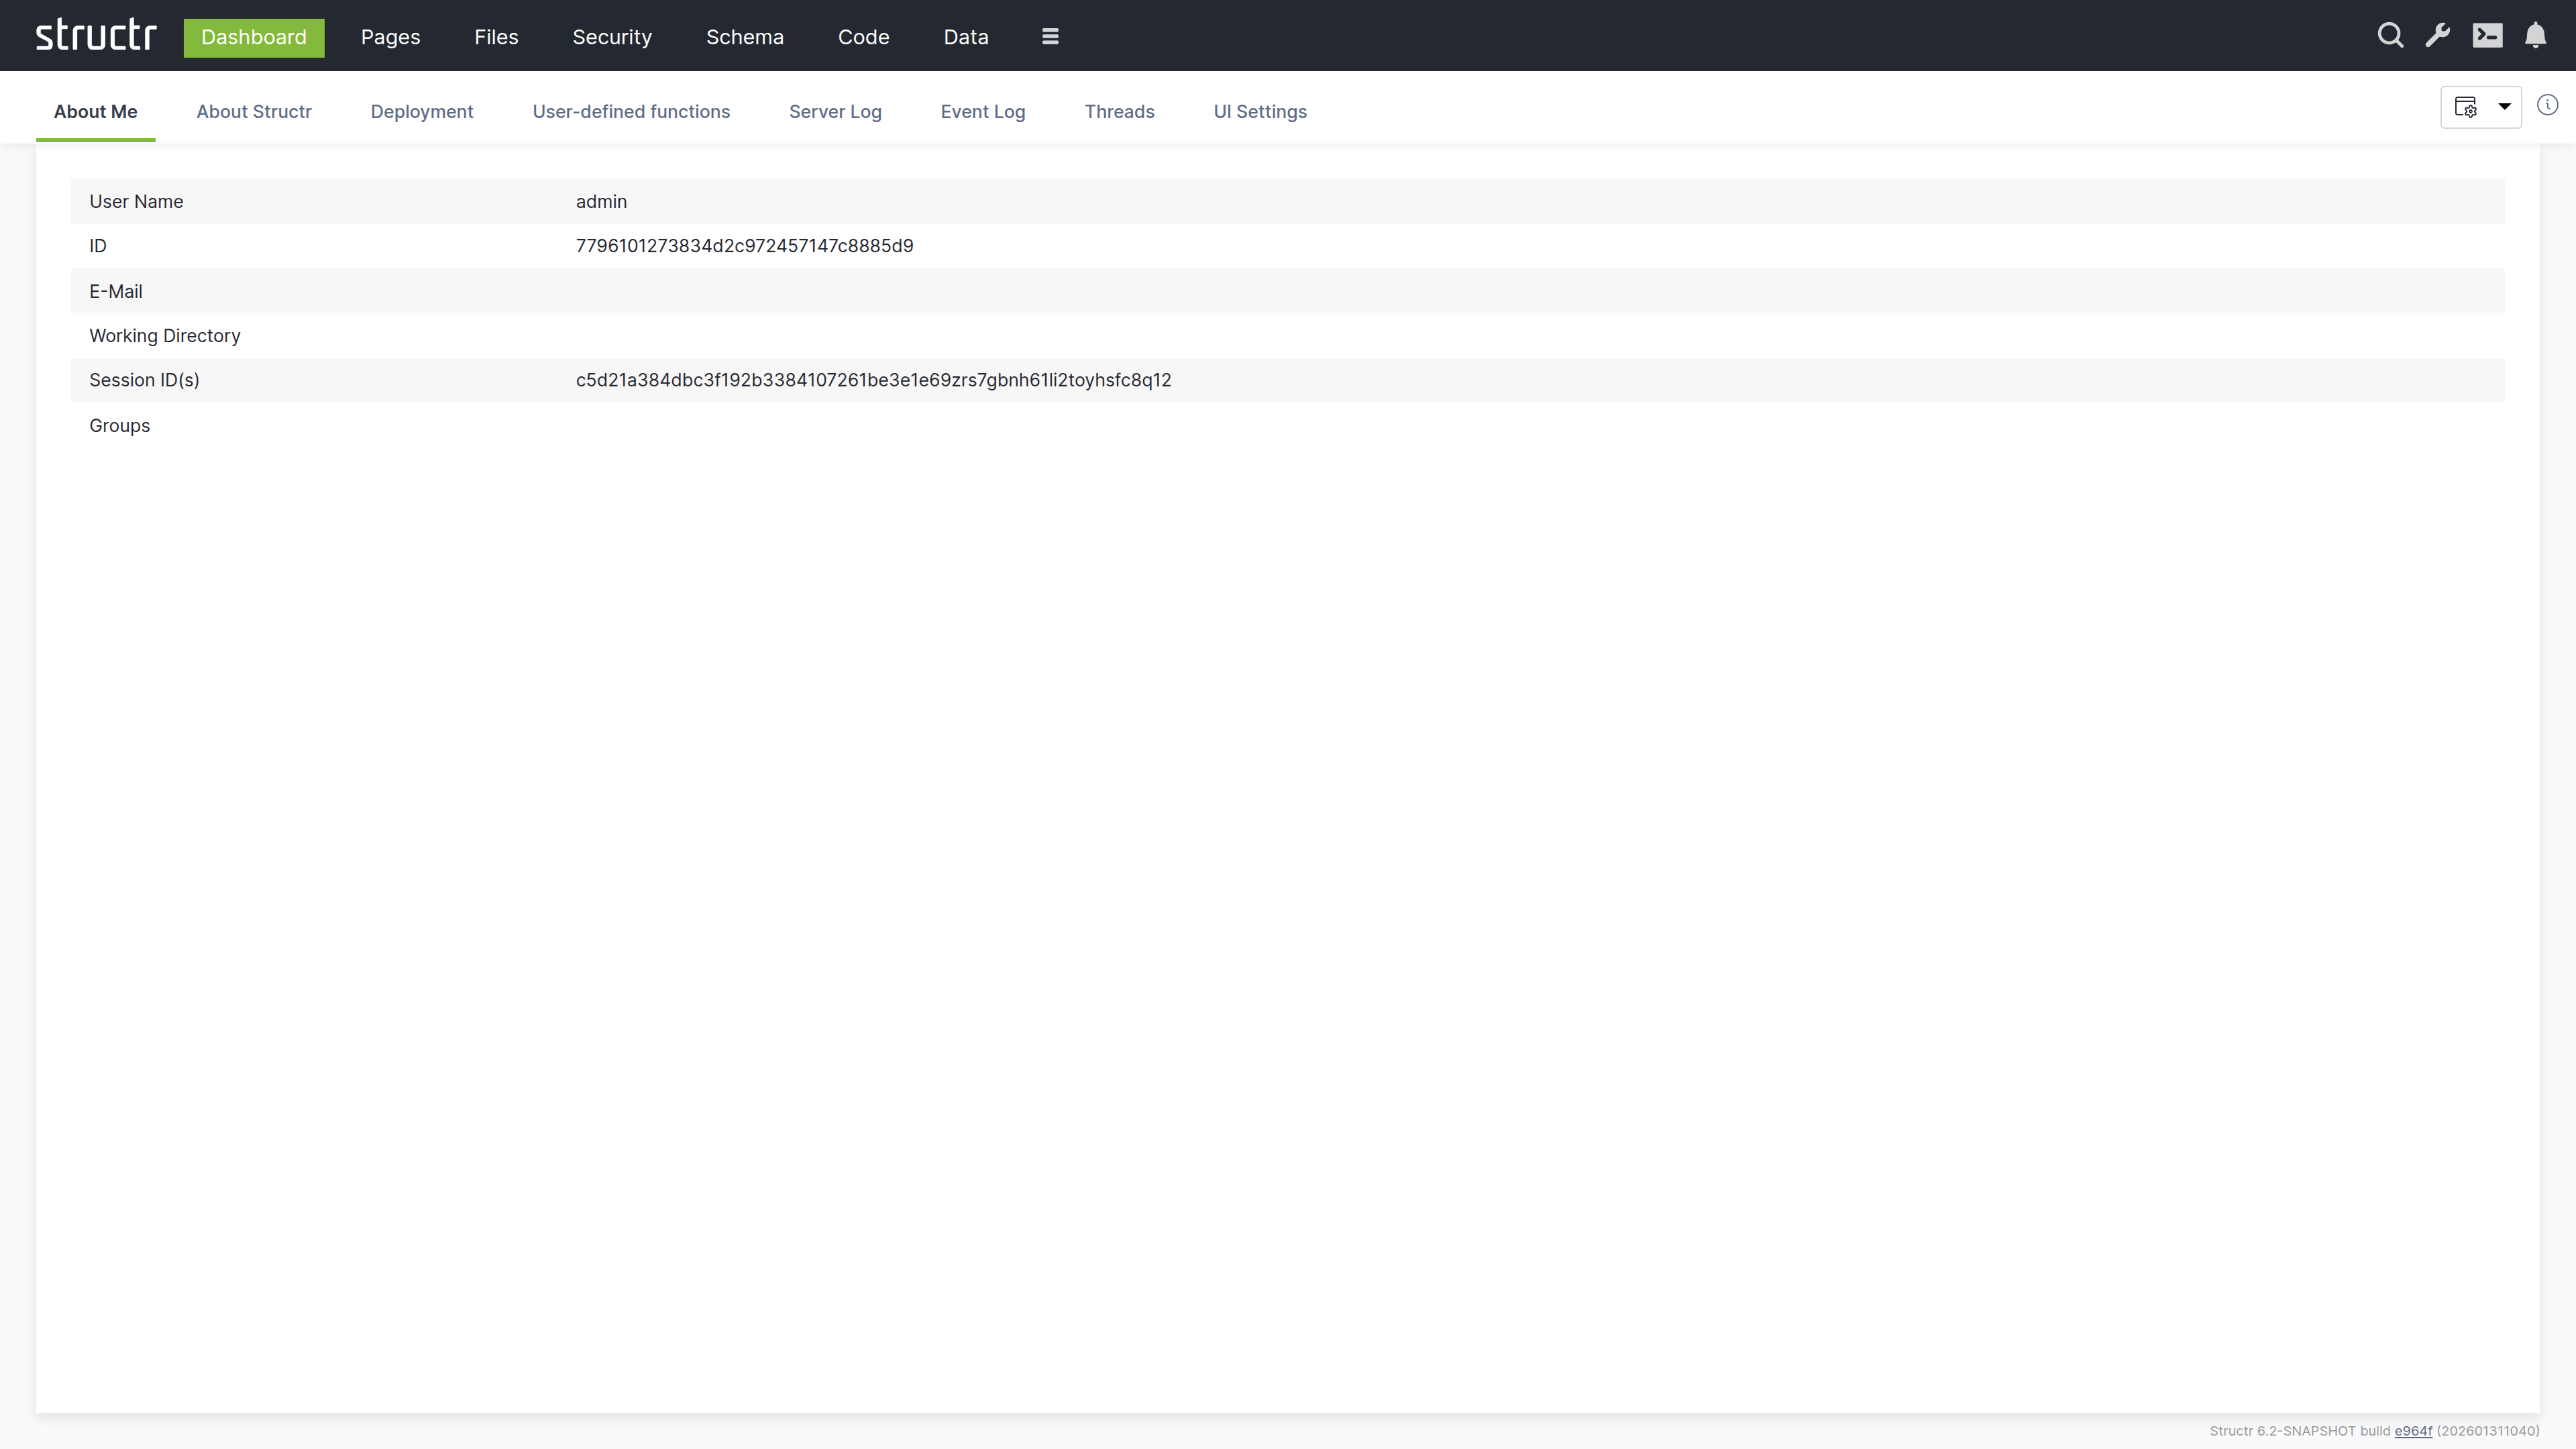
This tab shows information about the currently logged-in user. You can verify your identity, check which groups you belong to, and see your active sessions. This is useful when troubleshooting permission issues or when working with multiple accounts.
The tab displays:
- Username and UUID
- Email address
- Working directory
- Session IDs
- Group memberships
The Session ID is particularly useful for debugging. If you need to see your application from another user’s perspective, you can copy their Session ID from the table and set it in your browser. This allows you to experience exactly what that user sees without knowing their password.
About Structr
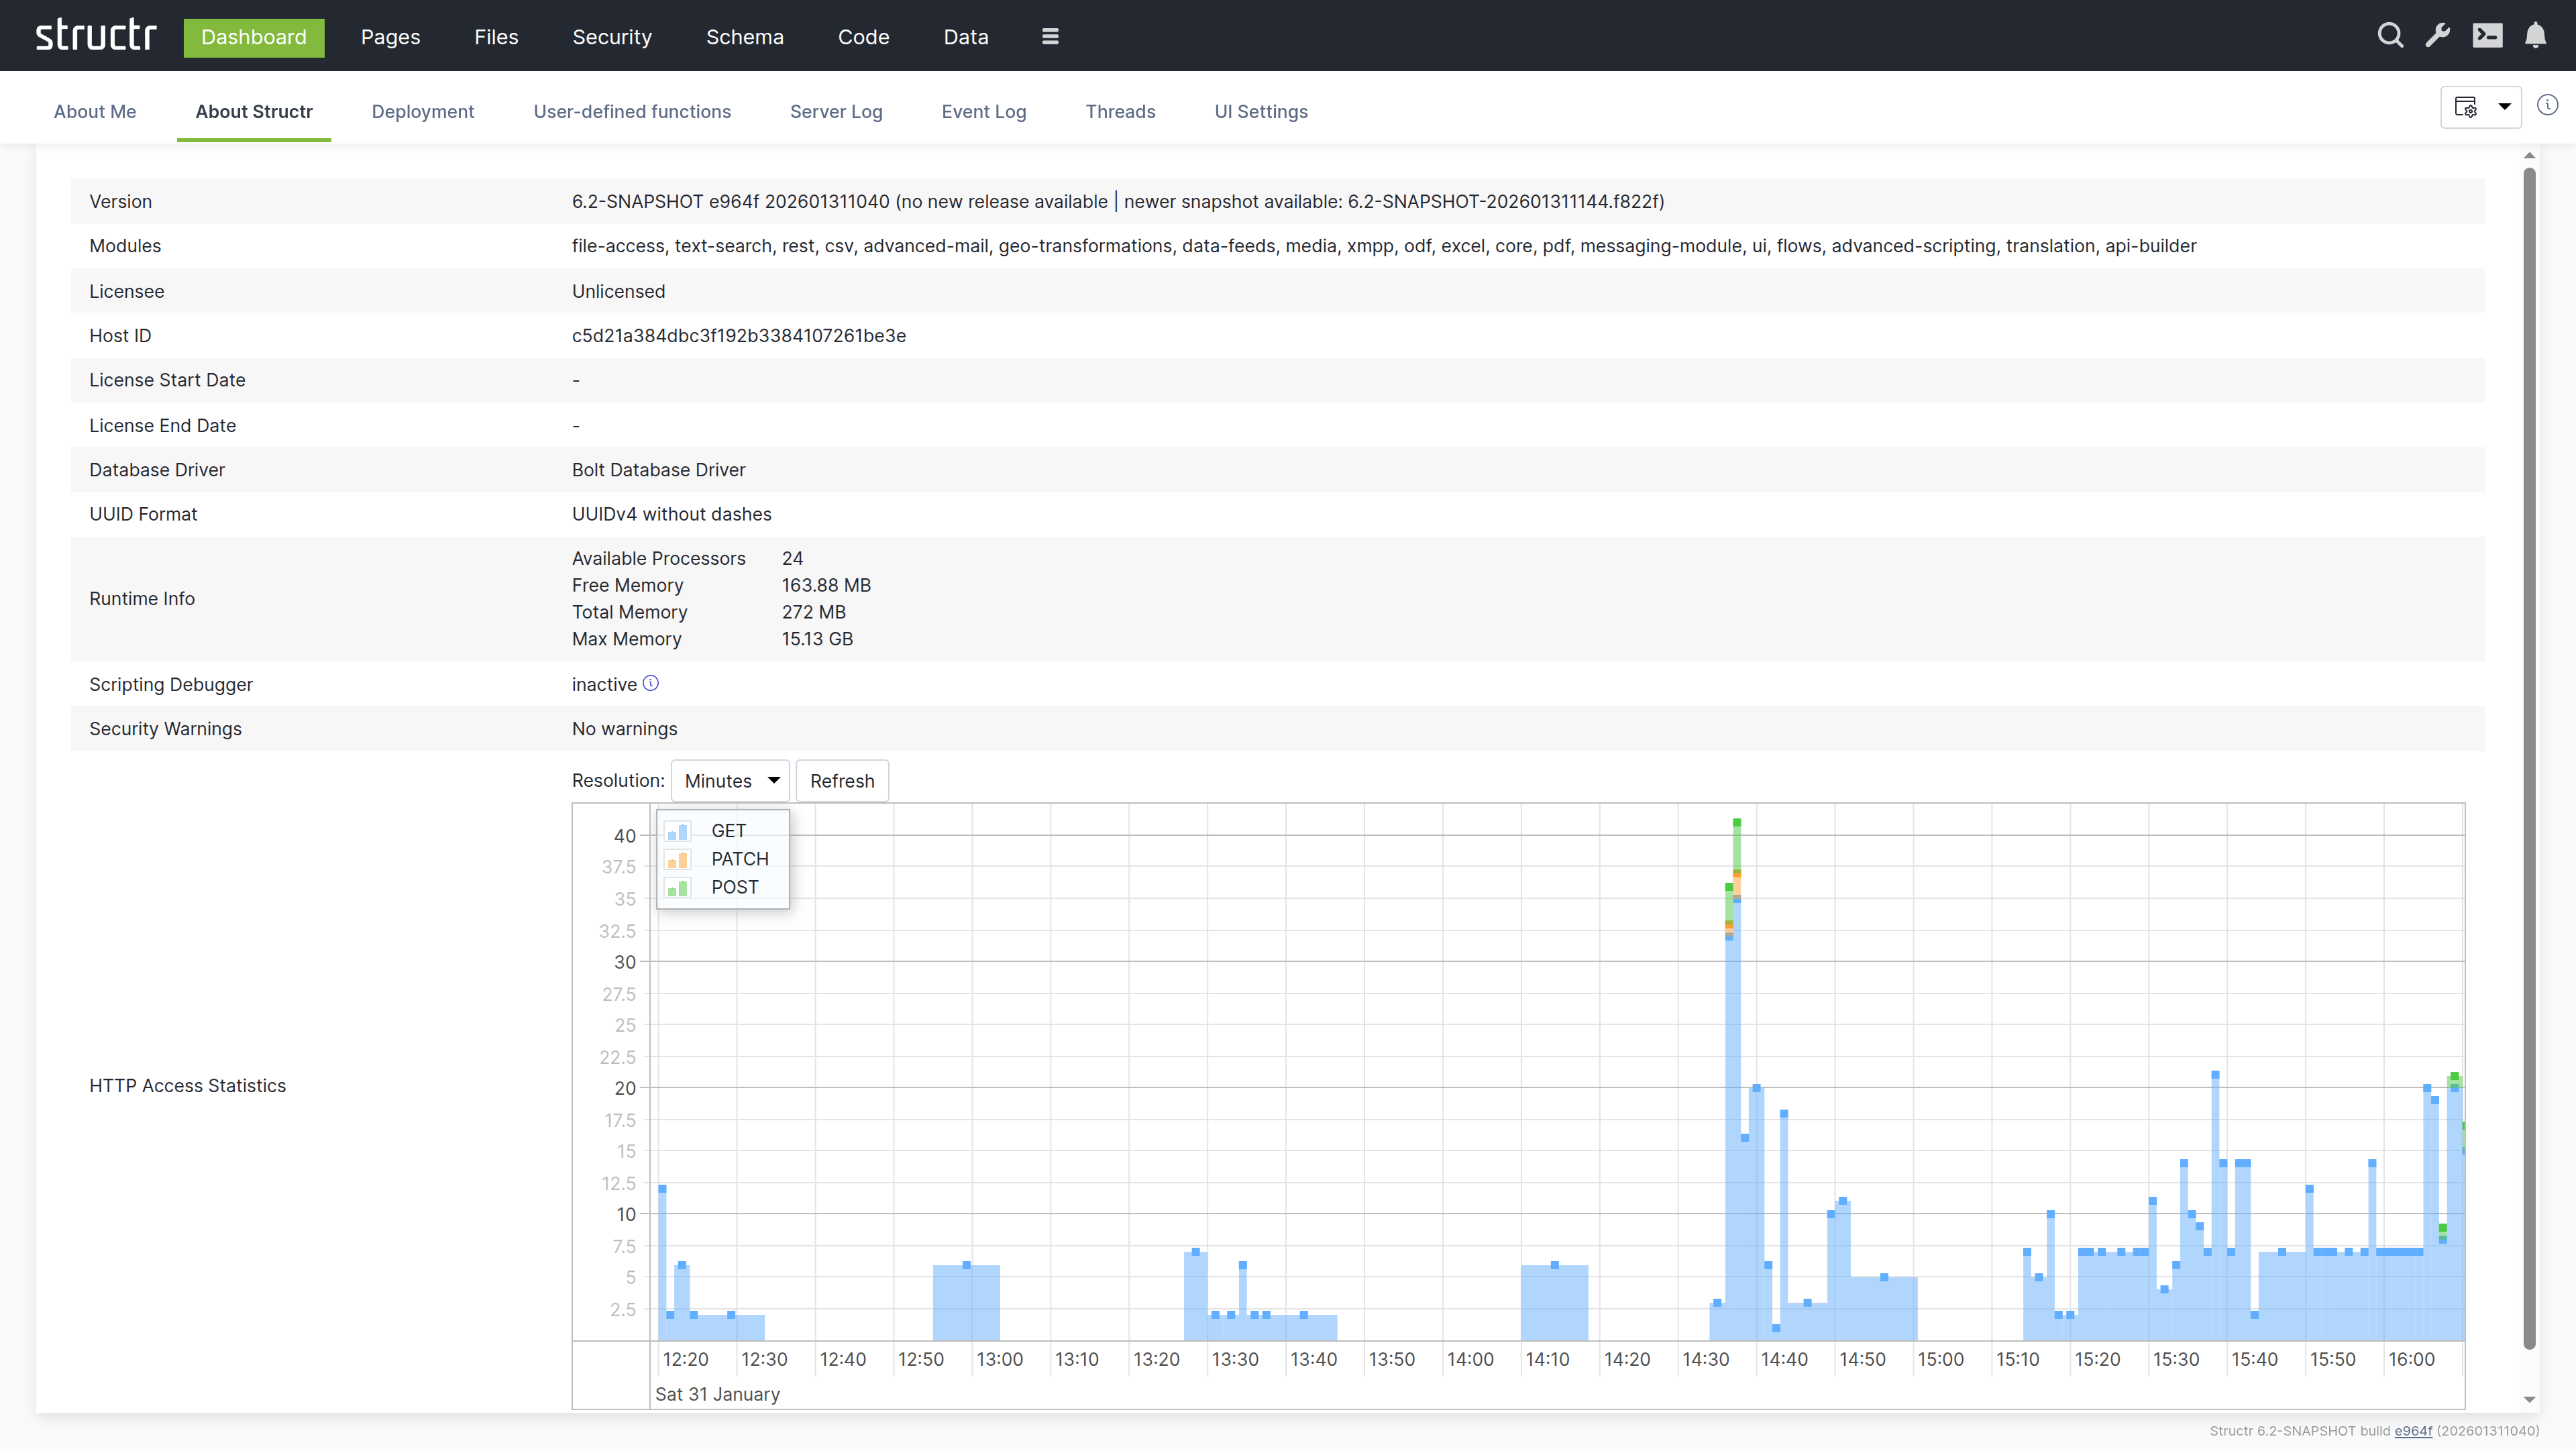
This tab shows detailed information about the Structr server instance. You can verify which version is running, which modules are available, and whether your license is valid.
Version and Modules
The version number identifies the exact build you are running. Indicators show whether newer releases or snapshots are available. Below the version, you will see a list of all active modules. Modules extend Structr’s functionality – for example, the PDF module adds PDF generation capabilities, and the Excel module enables spreadsheet import and export.
License and Database
The license section shows your licensee name, host ID, and the validity period (start and end date). You need the host ID when requesting a license from Structr.
The database section shows which driver is in use. Structr supports both embedded and external Neo4j databases.
UUID Format
This displays the current UUID format. Structr supports UUIDs with and without dashes. The format is configured at installation time and should not be changed afterwards.
Runtime Information
This section shows server resource information: number of processors, free memory, total memory, and maximum memory. You can monitor these values to assess server capacity and diagnose performance issues.
Scripting Debugger
This shows whether the GraalVM scripting debugger is active. The debugger allows you to set breakpoints and step through JavaScript code using Chrome DevTools. To enable it, set application.scripting.debugger = true in structr.conf. See Logging & Debugging for details.
Security Warnings
This row lists security-relevant findings about the current configuration, for example a default superuser password or an insecure setting. An empty row means no warnings were found.
Access Statistics
This is a filterable table showing request statistics: timestamps, request counts, and HTTP methods used. You can use this to analyze usage patterns and identify unusual access behavior.
Deployment
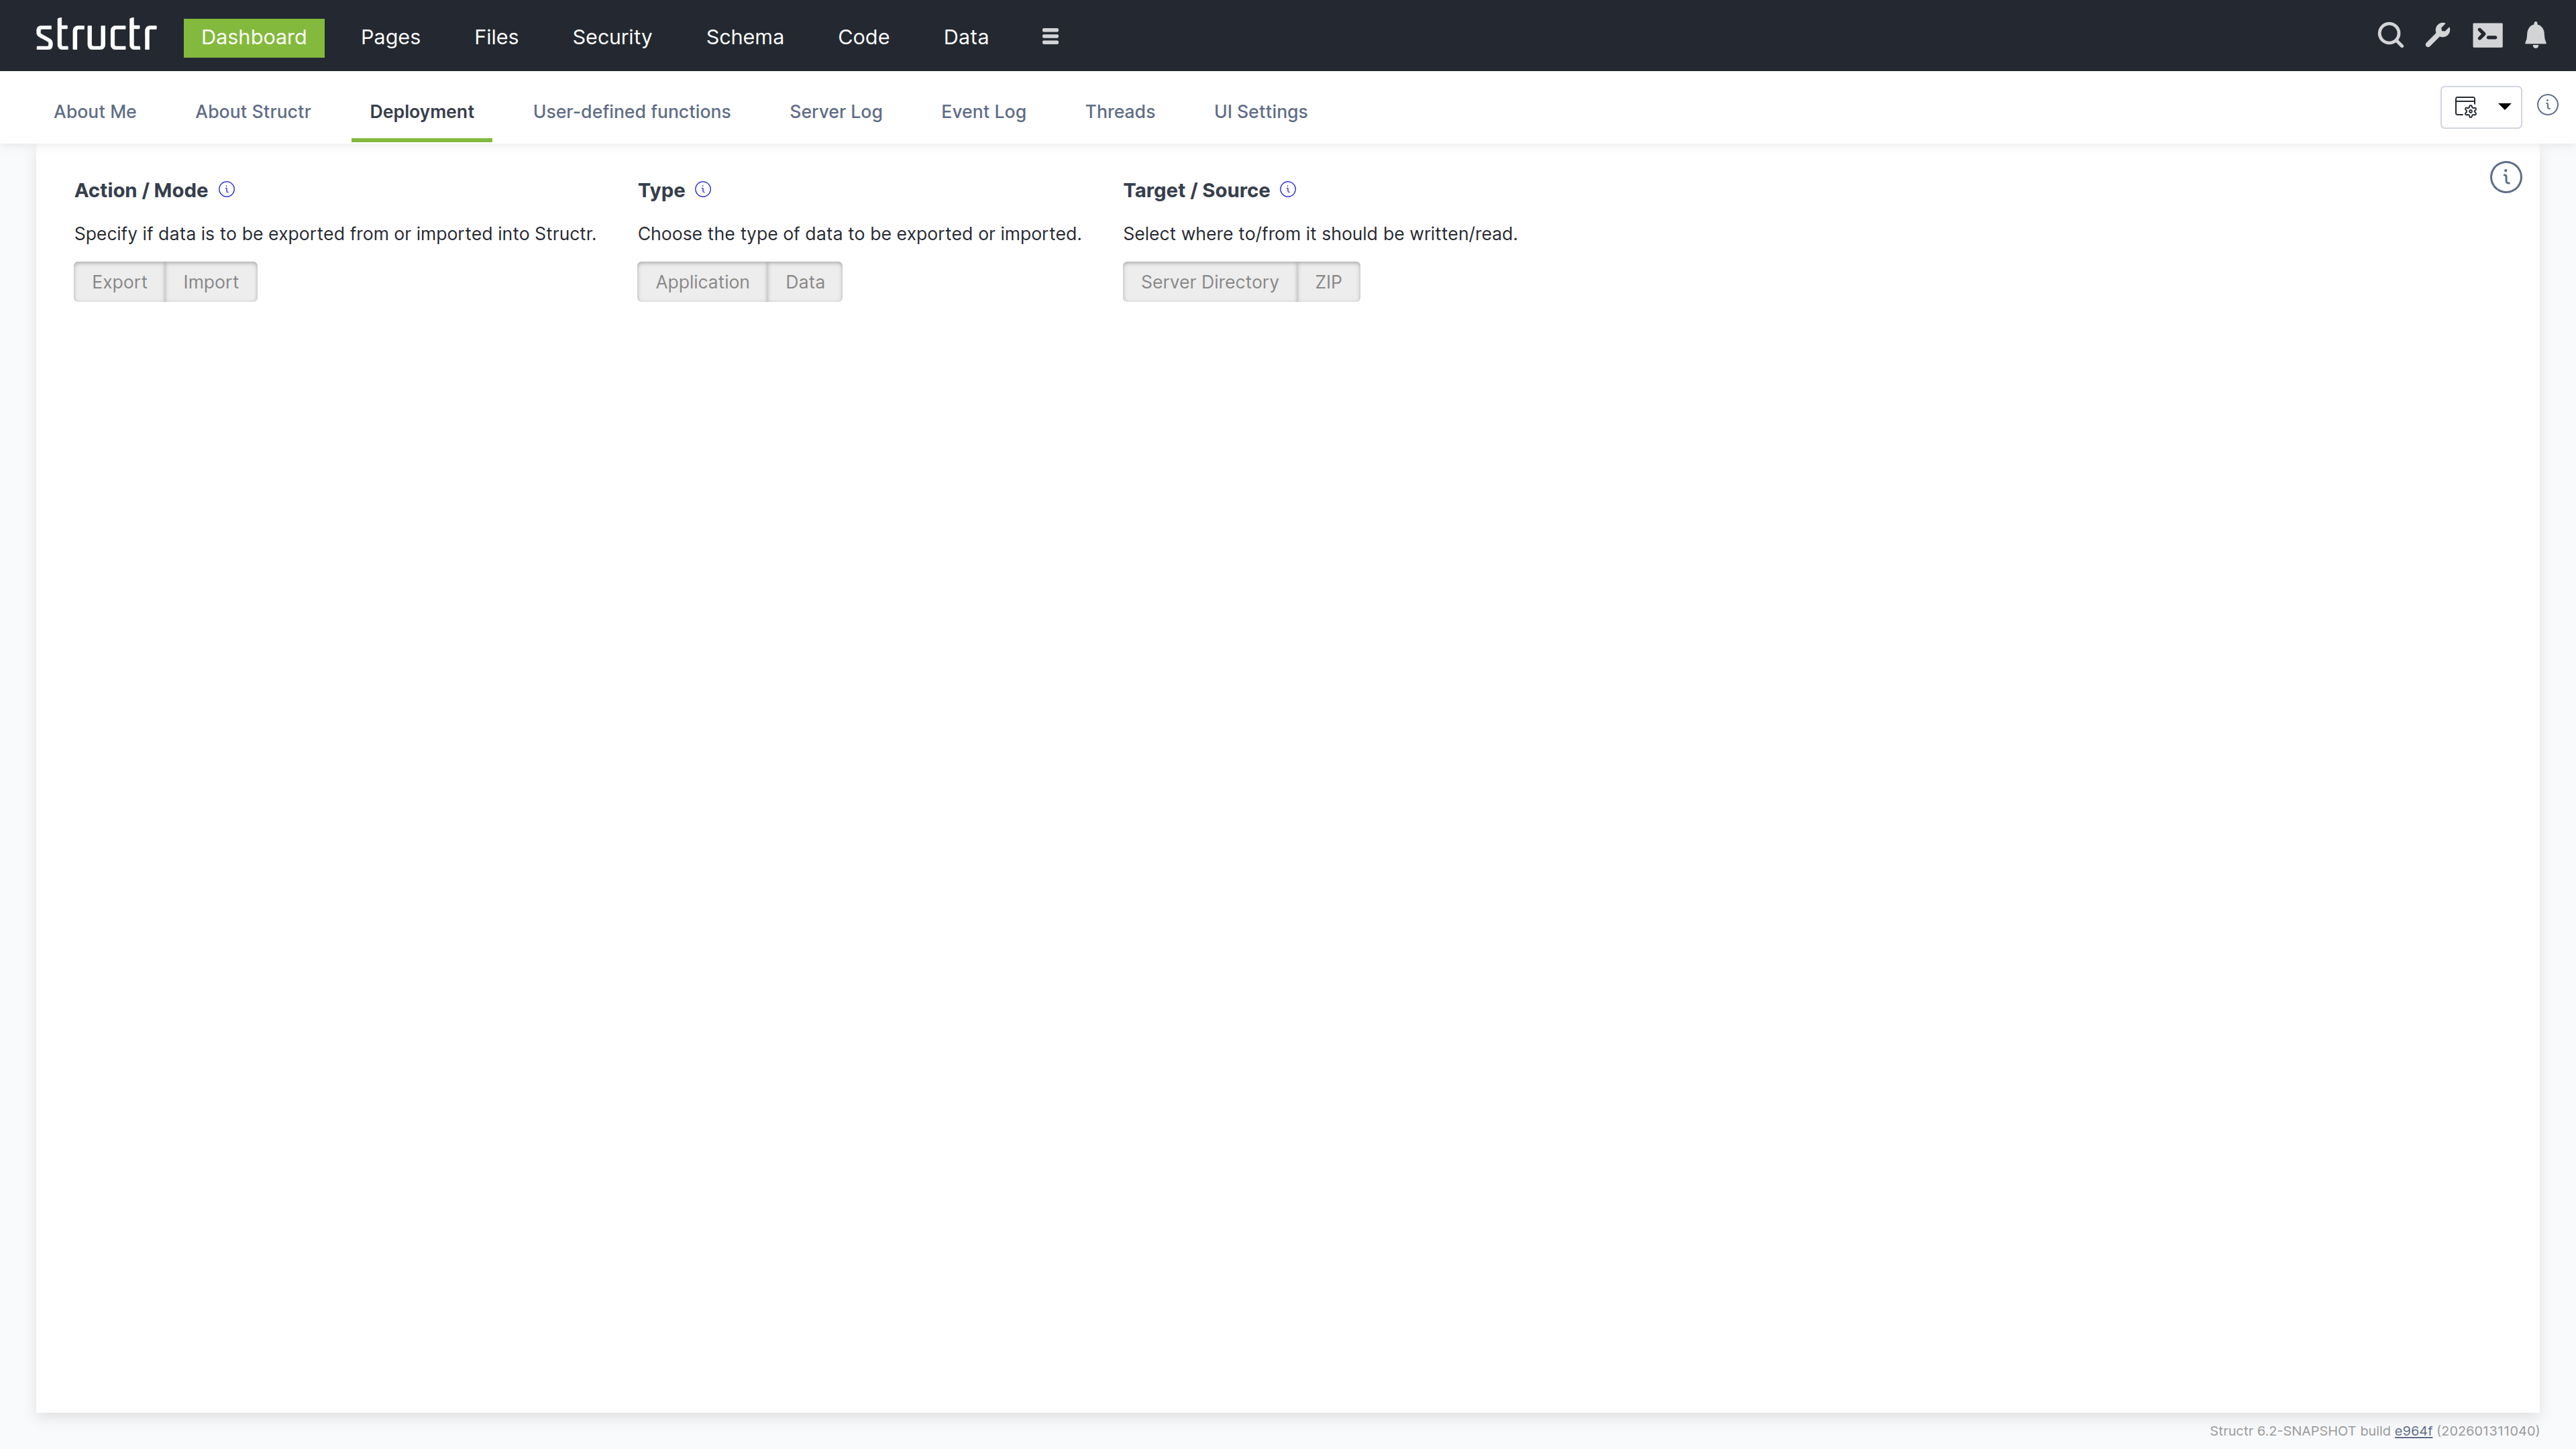
This tab provides tools for exporting and importing Structr applications and data.
Choosing an Operation
By default the tab shows the compact deployment UI. Three switches at the top narrow down what you want to do: Action (Export or Import), Type (Application or Data) and Target or Source (Server Directory or ZIP). Only the panel that matches the selected combination is shown. If you prefer to see all panels at once, disable “Use compact deployment UI” in the UI Settings; the tab then shows the classic layout with all application panels in the upper half and all data panels in the lower half.
Application Deployment
Application deployment exports and imports the structure of your application (schema, pages, files, templates, security settings, configuration). The panels are:
- Export application to a server directory: enter an absolute path on the server filesystem and click the button to export
- Export and download application as a ZIP file: set the ZIP file prefix, optionally append a timestamp, and download the export directly to your browser
- Import application from a server directory: enter the path to an existing export and click to import
- Import application from URL or upload a ZIP file: enter the download URL of a ZIP file or choose a local ZIP file for upload. If the webapp folder is not at the top level of the archive, enter its path in “Path to the webapp folder inside the ZIP file”
Data Deployment
Data deployment exports and imports the actual objects in your database. The panels mirror the application panels:
- Export data to a server directory: select the types to export, enter a path, and click to export
- Export and download data as a ZIP file: select the types, set the ZIP file prefix and optionally append a timestamp
- Import data from a server directory: enter the path to an existing data export and click to import
- Import data from URL or upload a ZIP file: enter a download URL or choose a local ZIP file, optionally with the path to the data folder inside the archive
The ZIP variants require the deployment servlet to be enabled; the corresponding inputs are disabled otherwise.
You can follow the progress of any export or import operation in the Server Log tab or via the notifications in the UI.
For details on the export format, pre/post-deploy scripts, and alternative deployment methods, see the Deployment chapter in Operations.
User-Defined Functions
This tab displays a table of all user-defined functions in the system. You can view and execute any function directly from this interface.
Each function is listed with its name and can be executed by clicking on it. This provides a quick way to run maintenance tasks, test functions, or trigger administrative operations without using the API or Admin Console.
Server Log
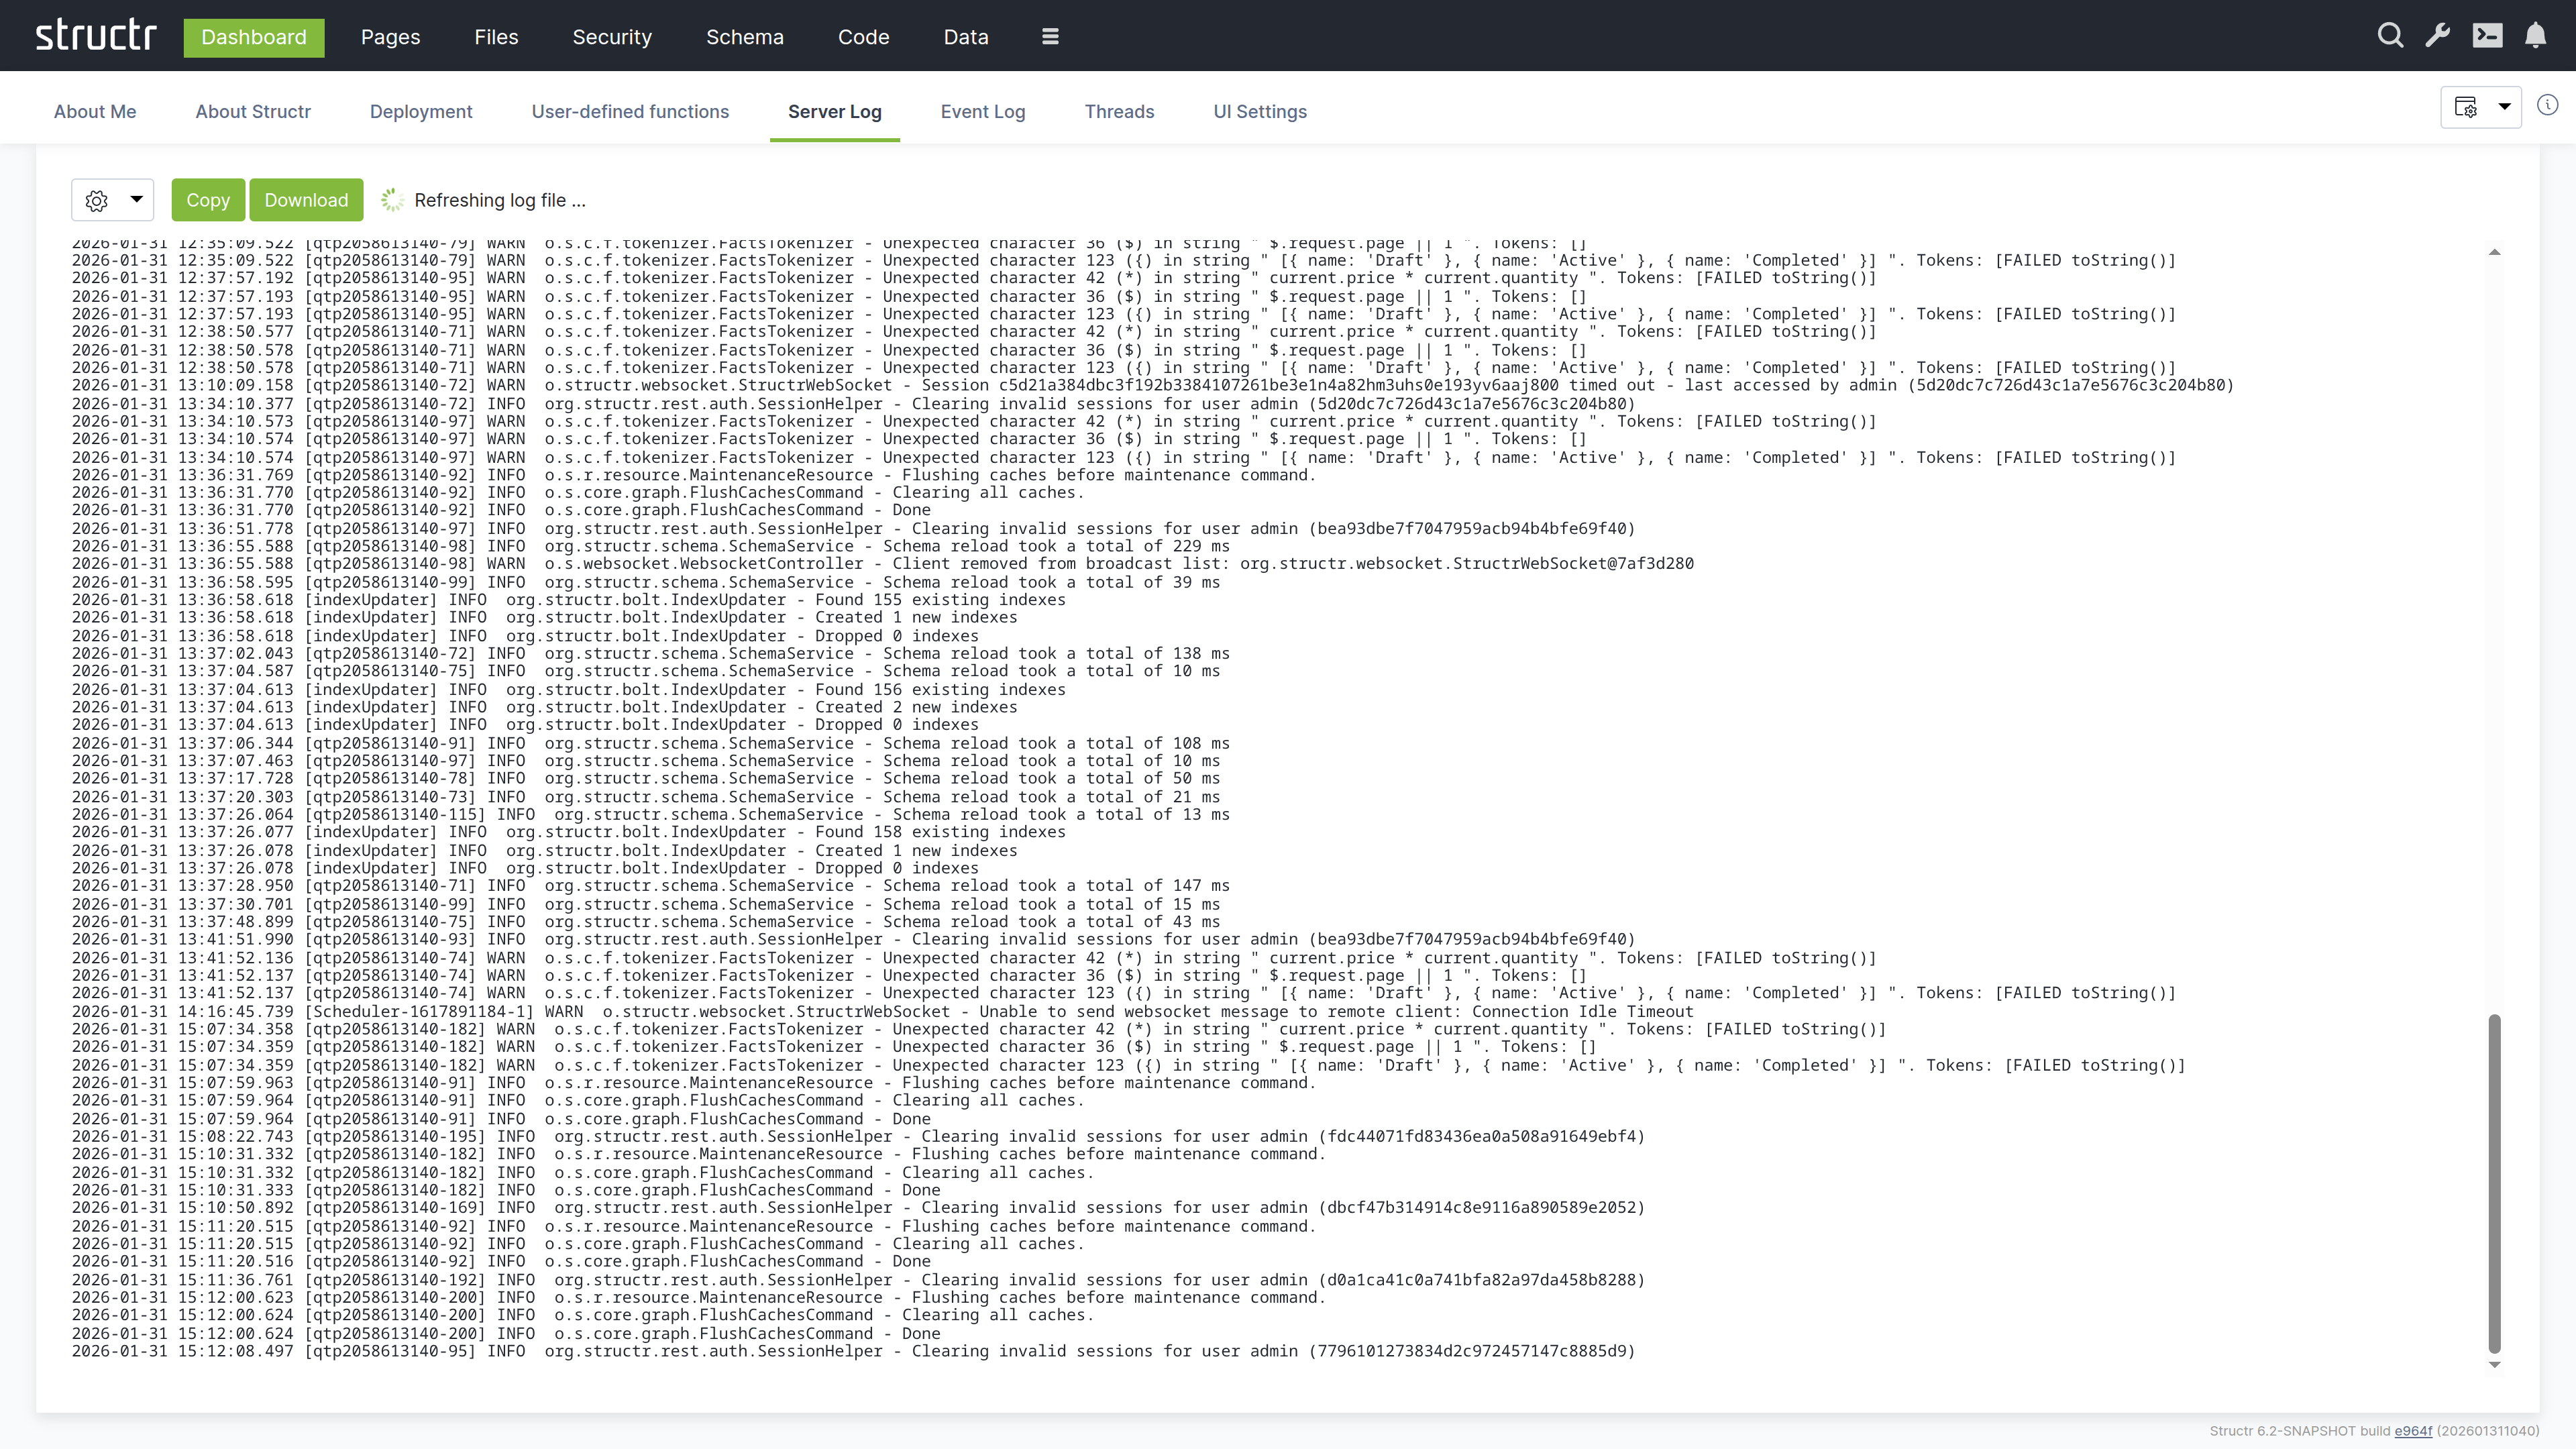
This tab displays the server log in real-time. The log contains technical information about what Structr is doing: startup messages, errors, warnings, request processing, and transaction details.
Controls
The log refreshes every second by default and scrolls to the end after each refresh. Scrolling up in the log area stops the automatic scrolling so you can read a specific message; the content itself keeps refreshing until you scroll back to the end or set the interval to manual. The available controls are:
- Copy to clipboard
- Download log file
- Refresh interval (10s, 5s, 2s, 1s, or manual, which shows a Refresh button)
- Number of lines to display
- Truncate lines at: cuts off long lines after the given number of characters
- Filter: shows only lines containing the entered text
- Log source selection (Structr supports multiple log files when rotation is enabled)
Log Format
Each log entry follows the format: Date Time [Thread] Level Logger - Message
For example:
2026-01-28 09:40:18.126 [main] INFO org.structr.Server - Starting Structr 6.1-SNAPSHOT
The log levels are INFO (normal operation), WARN (potential issues that do not prevent operation), and ERROR (problems that need attention).
Event Log
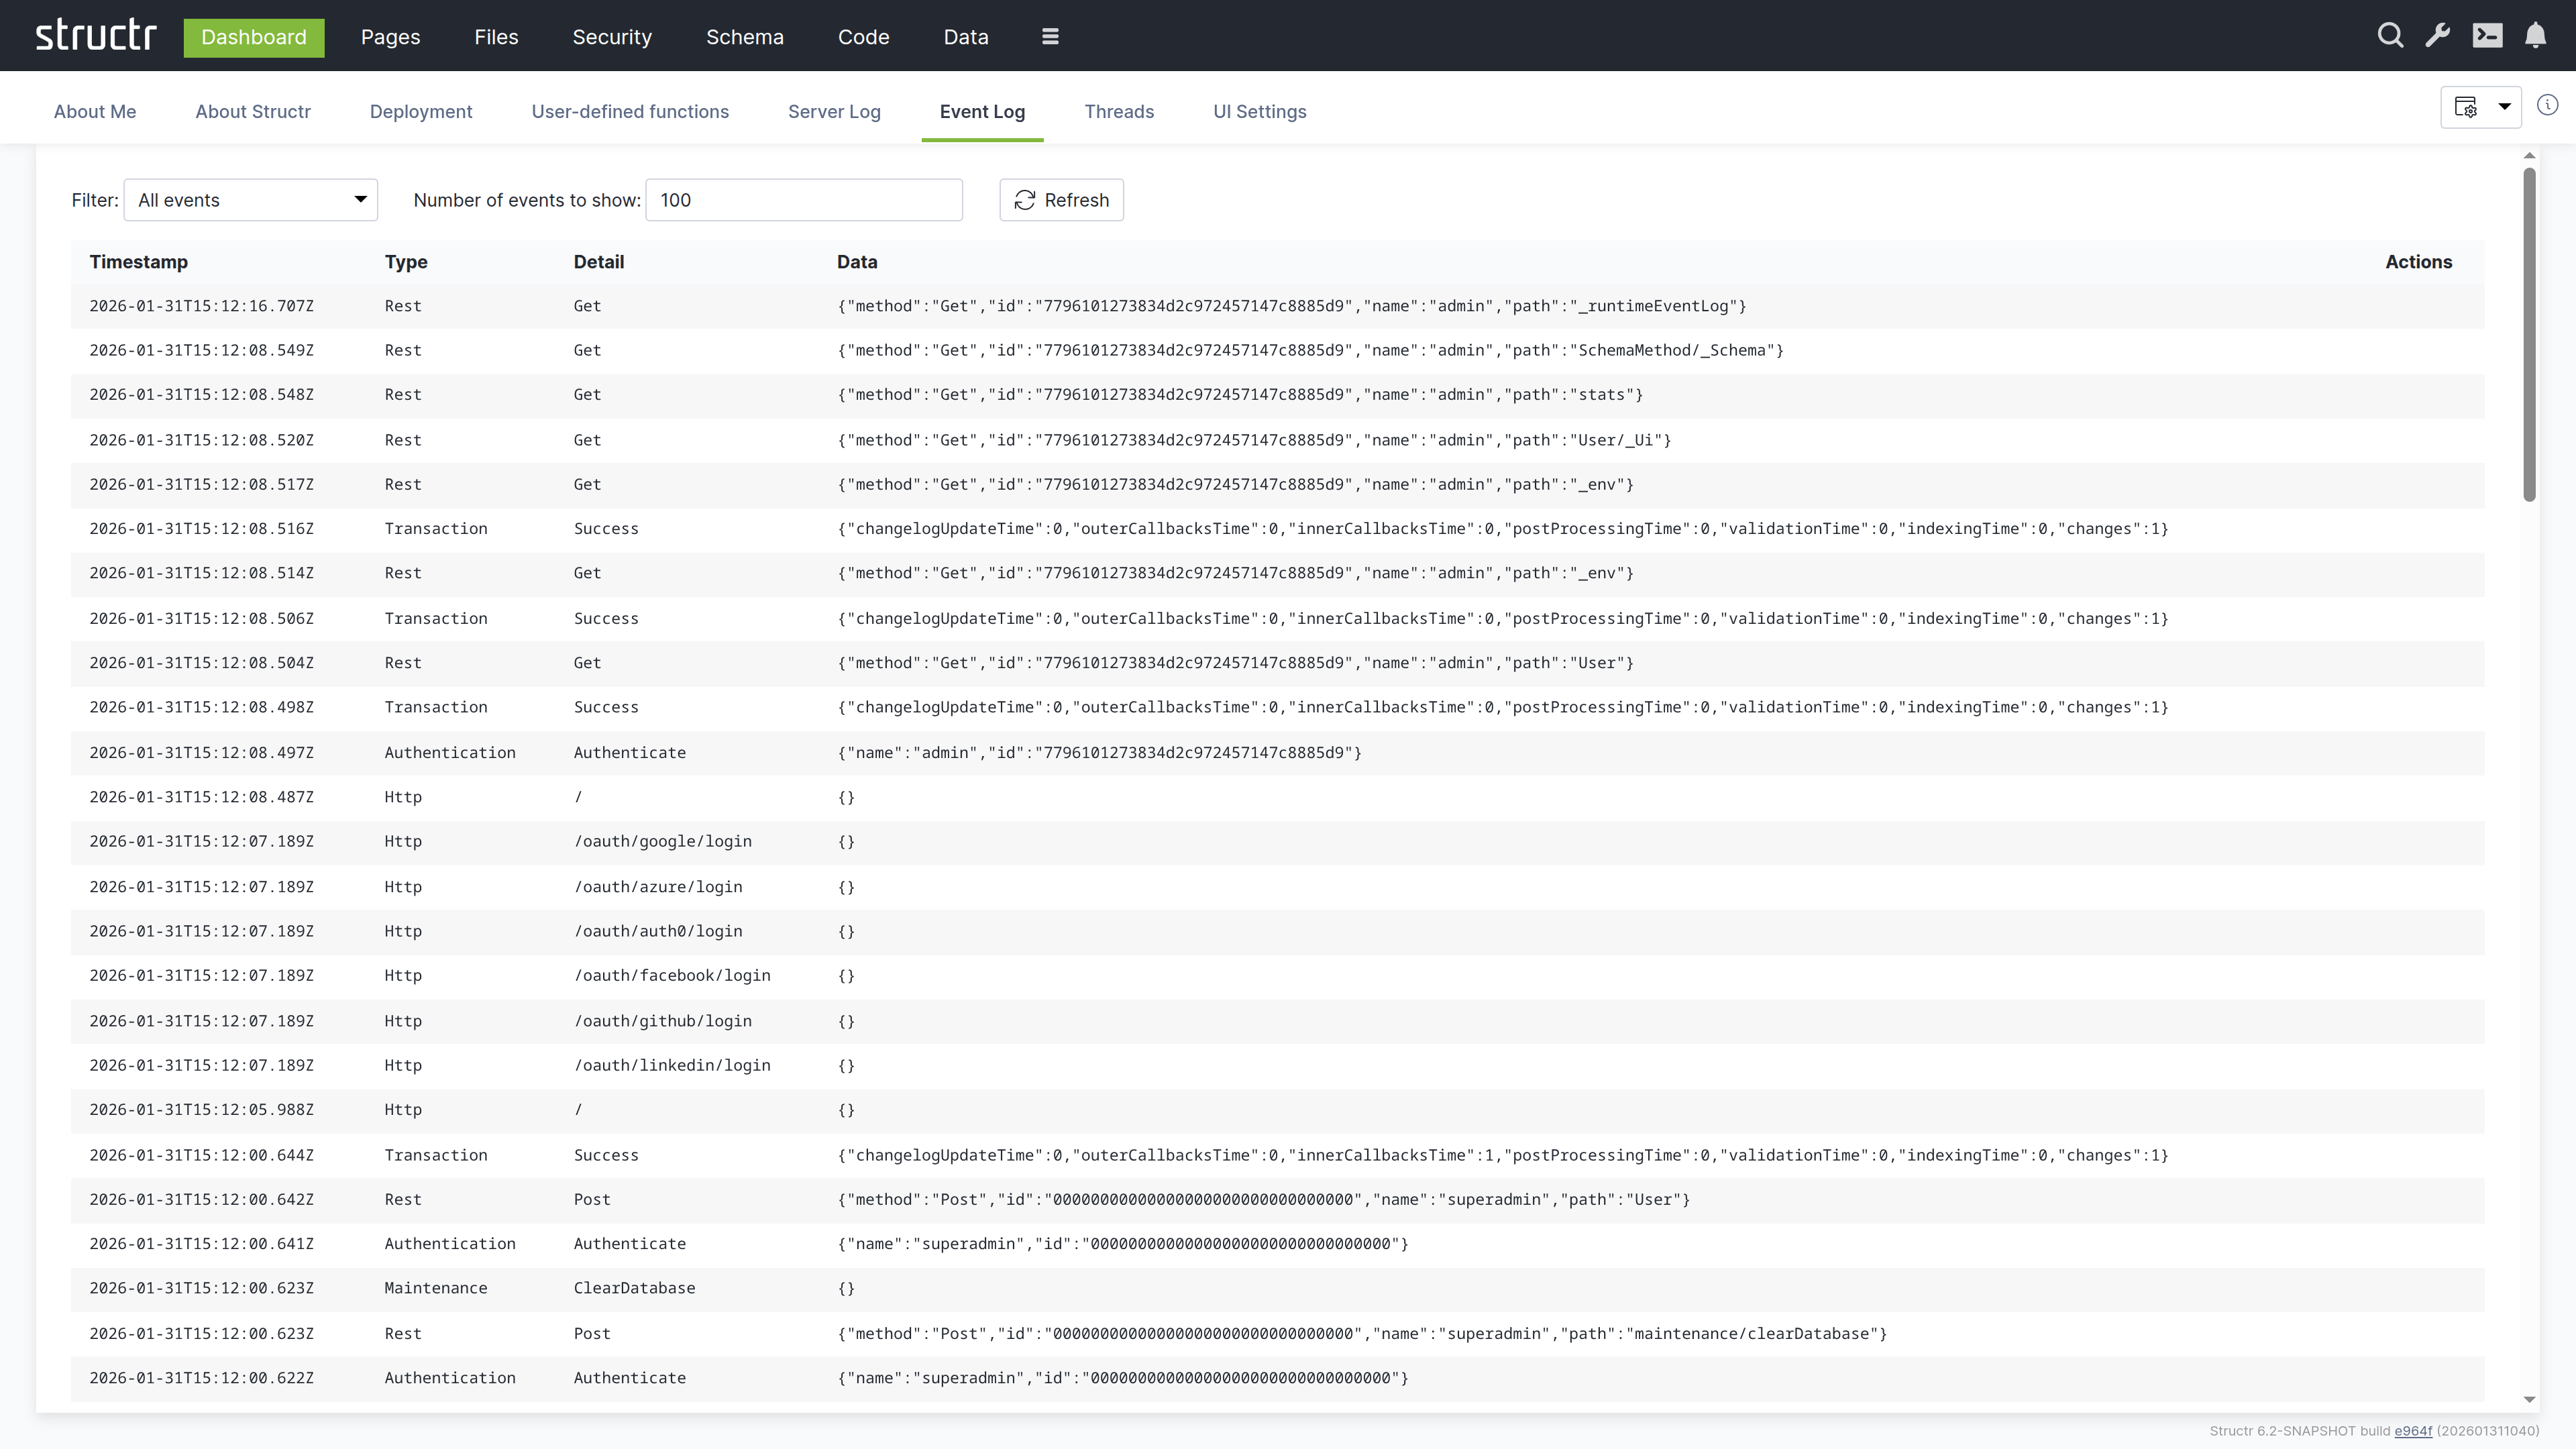
This tab shows a structured view of system events: API requests, authentication events, transactions, and administrative actions. Unlike the server log which contains free-form text, the event log presents events as filterable table rows with consistent columns.
Event Types
The type filter offers the following event types:
- Authentication: login and logout events with user information
- Cron: scheduled function runs
- Http: page requests and OAuth login attempts
- Maintenance: administrative commands
- Scripting: scripting errors and warnings
- REST: API requests with method, path, and user details
- ResourceAccess: denied requests due to missing resource access permissions
- Transactions: database transactions with performance metrics (changelog updates, callbacks, validation, indexing times)
- SystemInfo: system messages
Using the Event Log
The event log does not auto-refresh. Click the refresh button to update it. You can filter by event type and by thread name to focus on specific activities, and set the page size to control how many events are loaded. The table has the columns Timestamp, Type, Thread Name, Detail, Data, and Actions. The transaction events include timing breakdowns that can help you identify performance bottlenecks.
Threads
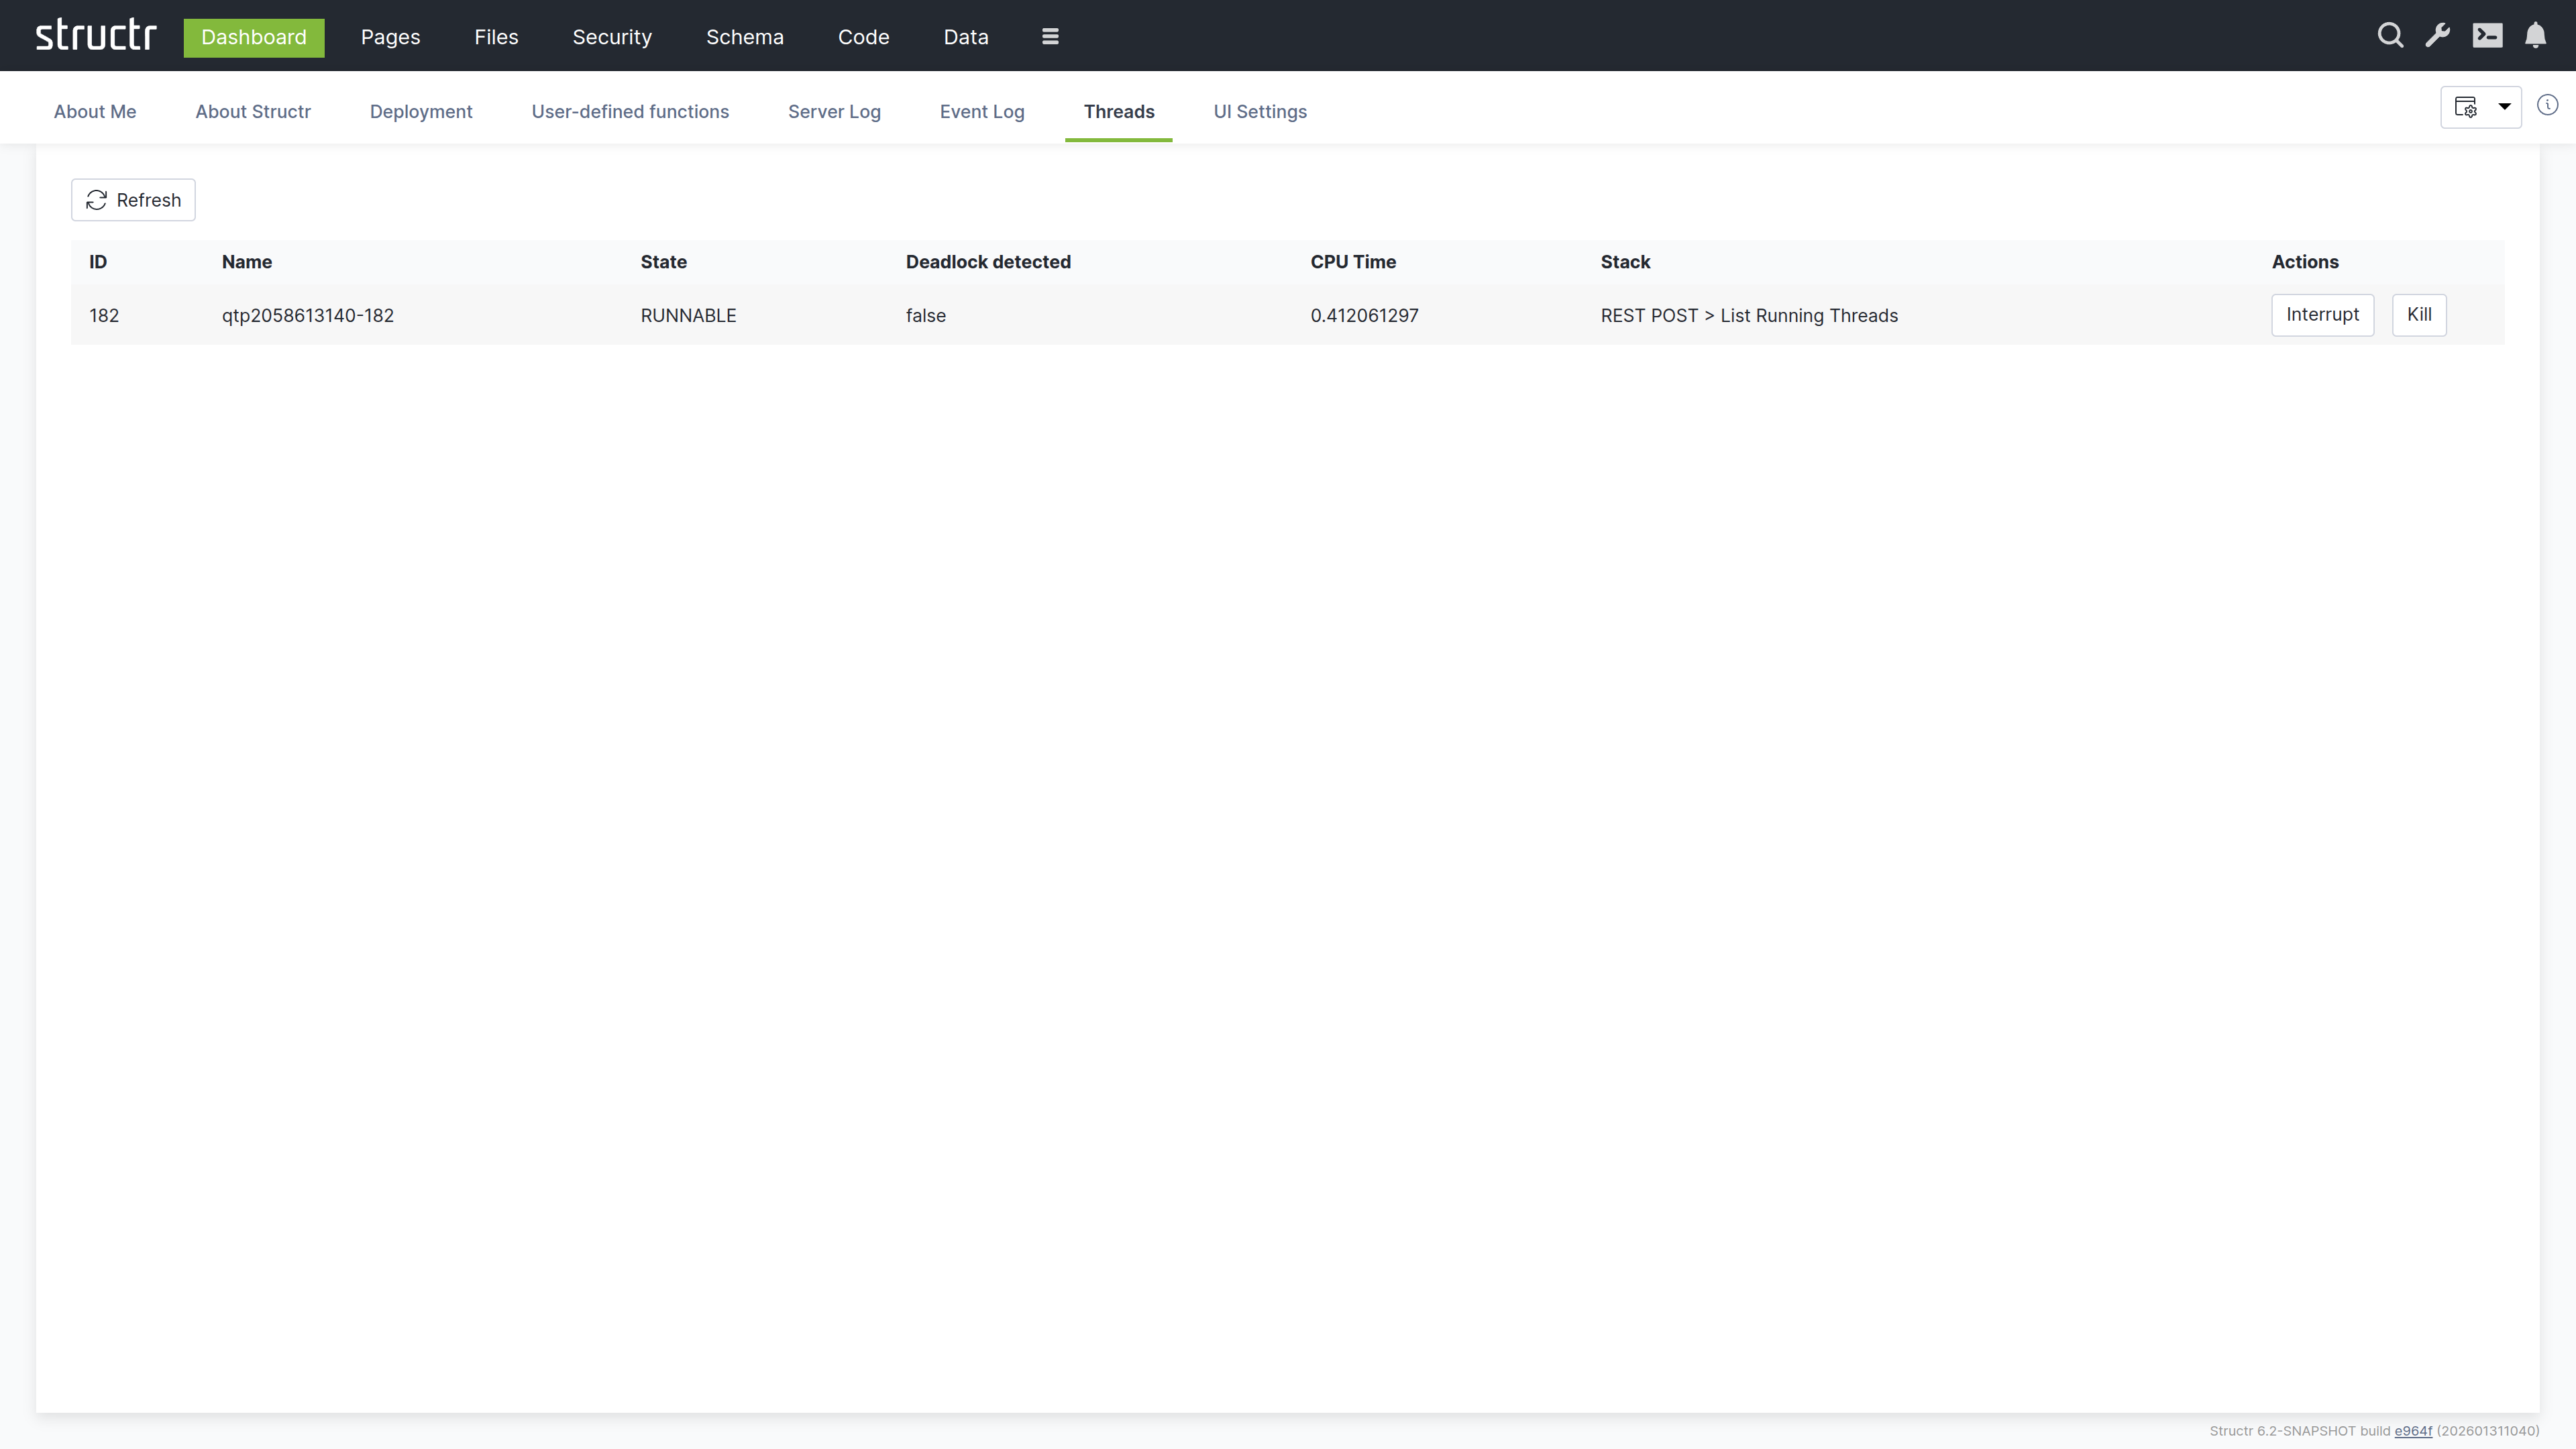
This tab lists all threads running in the Java Virtual Machine. The table has the columns ID, Name, State, Deadlock detected, CPU Time, Stack, and Actions. You can use this tab to diagnose hanging requests, infinite loops, or deadlocks.
Thread Management
Two actions are available for each thread:
- Interrupt – Requests graceful termination
- Kill – Forces immediate termination (use with caution)
Long-running threads may indicate problems in your application code, such as infinite loops or deadlocks.
UI Settings
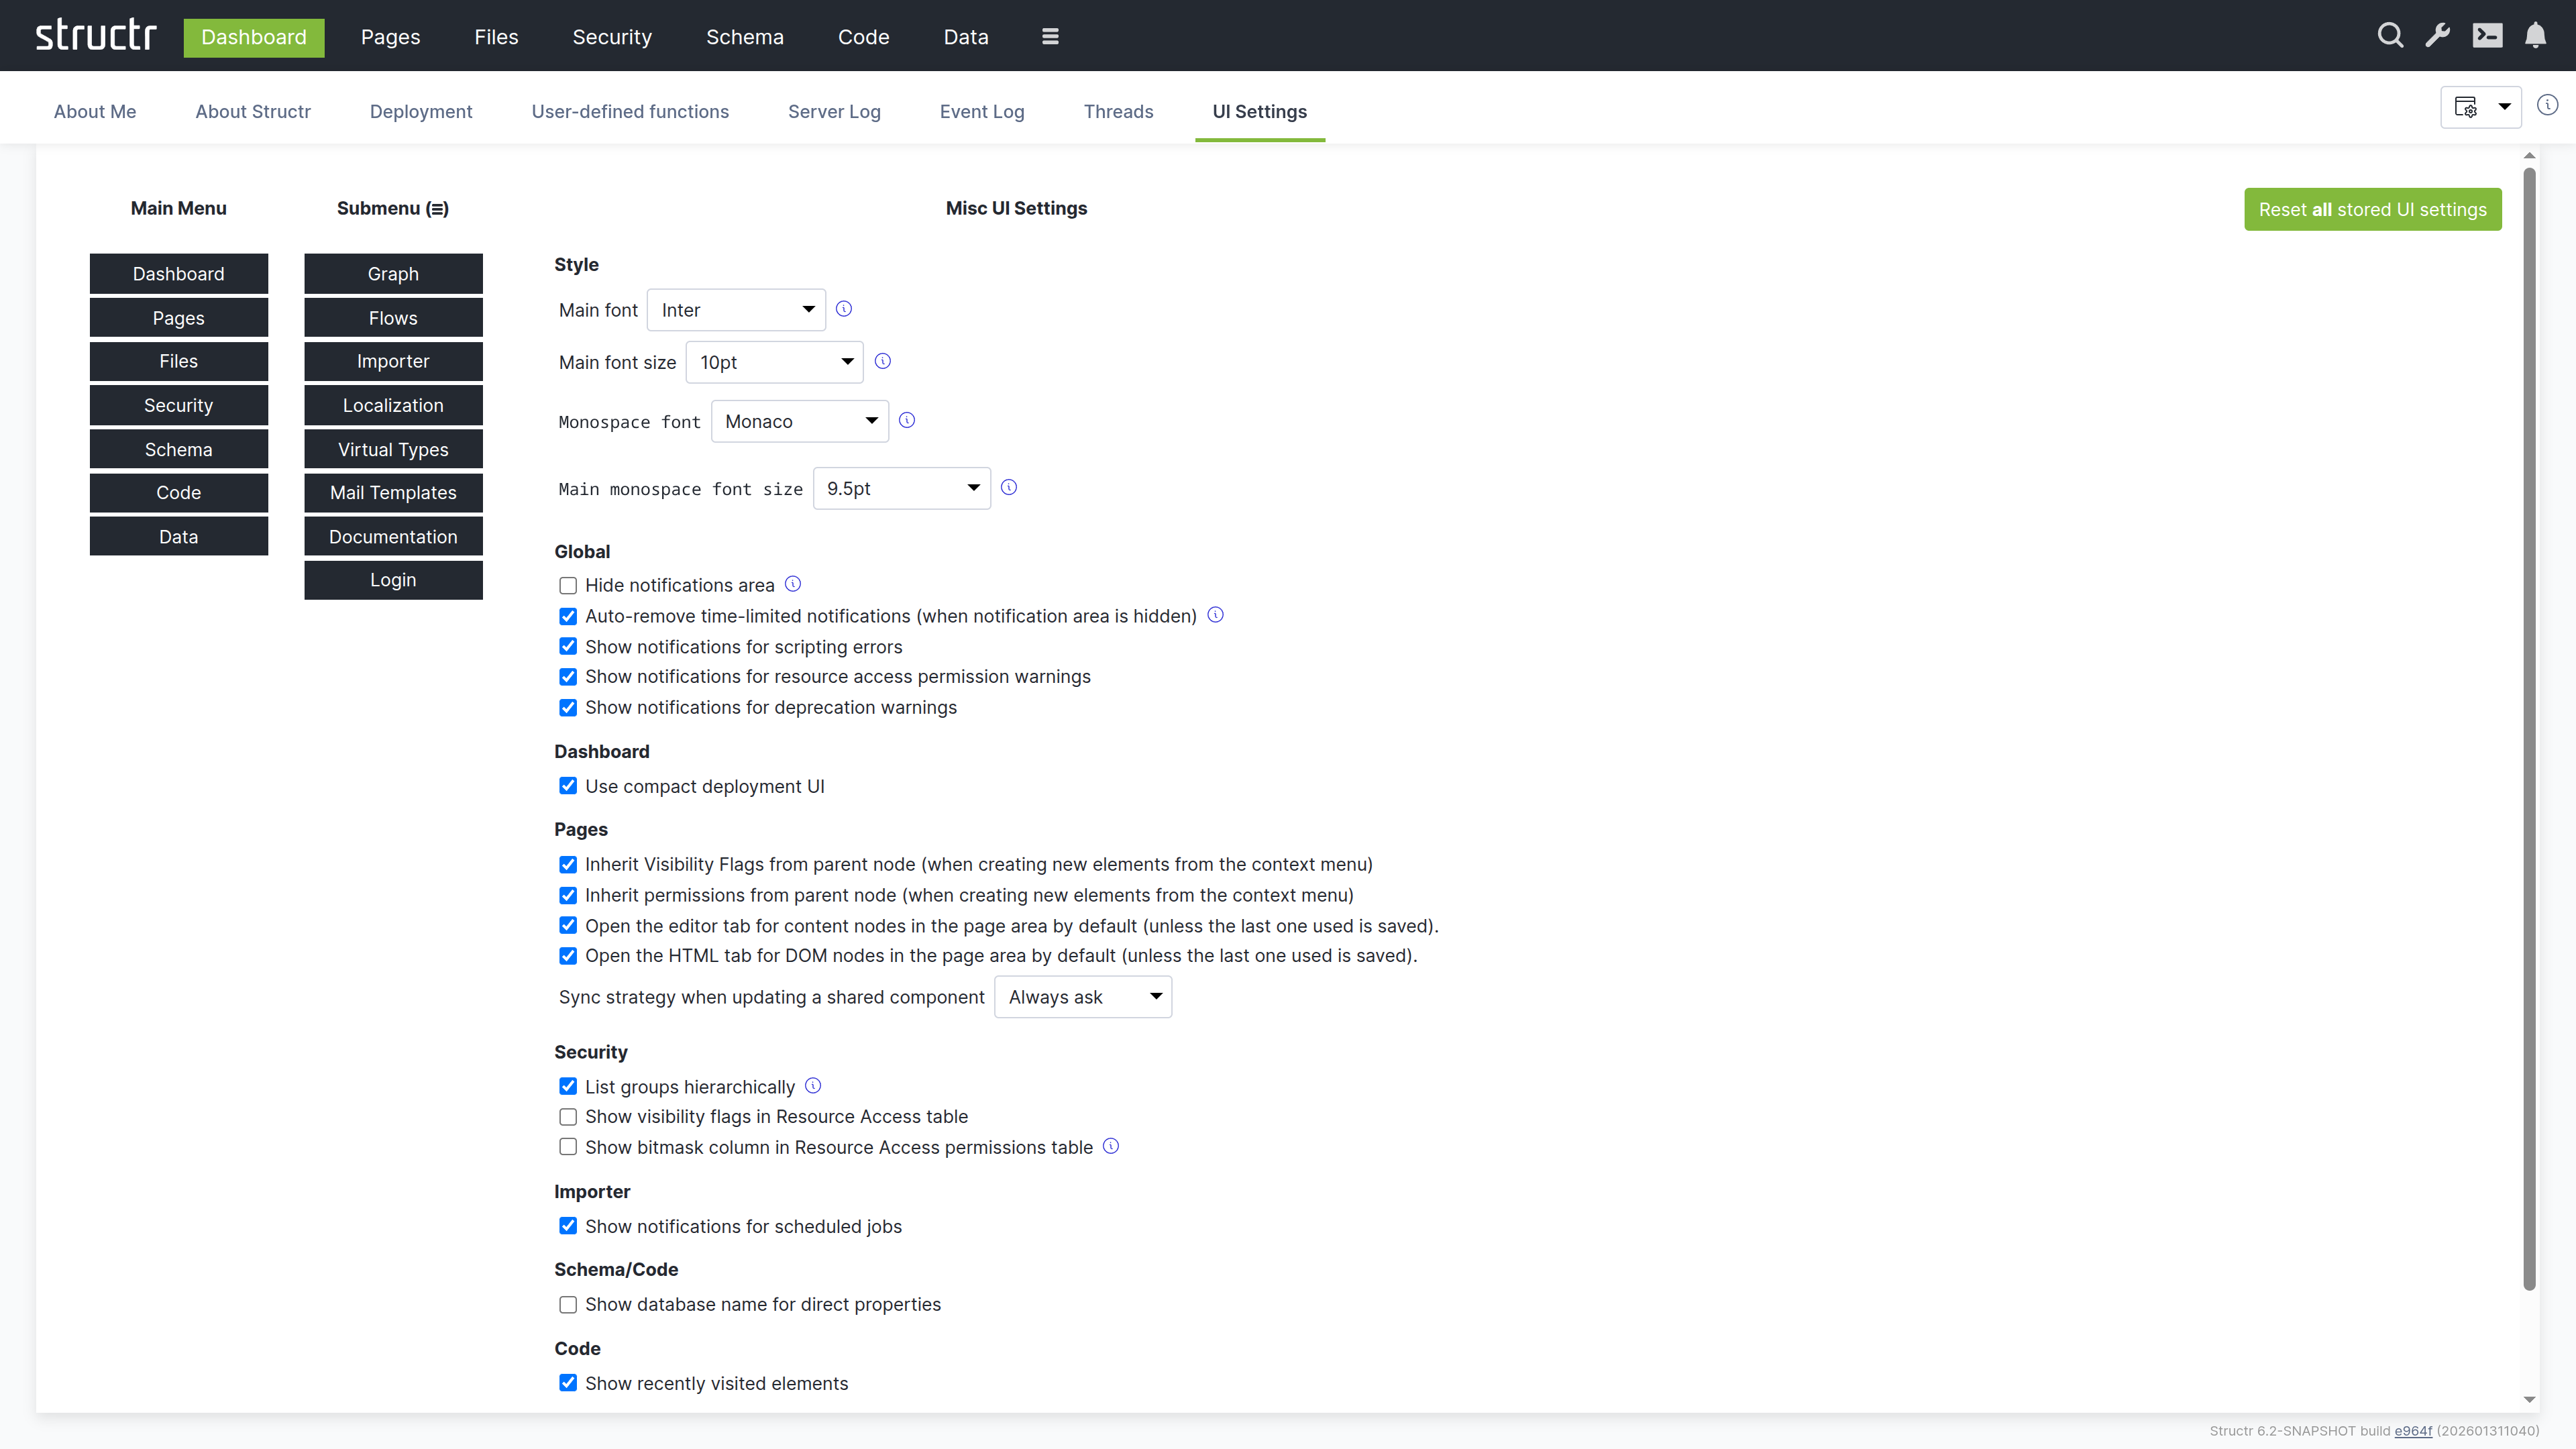
This tab lets you configure the Admin UI appearance and behavior. Changes take effect immediately and are stored per user.
Menu Configuration
Here you can configure which items appear in the main navigation bar and which are moved to the burger menu. This lets you prioritize the areas you use most frequently.
Font Settings
You can set the main font, font size, and monospace font for the Admin UI. The monospace font is used in code editors and log displays.
Behavior Settings
This section contains the settings grouped by area. The Style group holds the font settings described above. The remaining groups are:
- Global: hide the notifications area, auto-remove time-limited notifications, and show notifications for scripting errors, resource access permission warnings (authenticated and unauthenticated requests) and deprecation warnings
- Dashboard: use the compact deployment UI
- Pages: enable edit features in the page preview, inherit visibility flags and access rights from the parent node when creating elements from the context menu, and the sync strategy when updating a shared component
- Security: list groups hierarchically, show visibility flags and the bitmask column in the Resource Access table
- Job Queue: show notifications for scheduled jobs
- Schema/Code: show the database name for direct properties, ignore non-unique relationship type warnings
- Data: only show the contents of array attributes if they are shorter than the given size
The button “Reset all stored UI settings” at the bottom removes every stored setting and restores the defaults.
Note that the settings relevant to a specific area also appear in a Settings menu within that area. For example, the Pages settings are available both here and in the Pages area’s own Settings menu. This allows you to adjust settings without navigating back to the Dashboard.